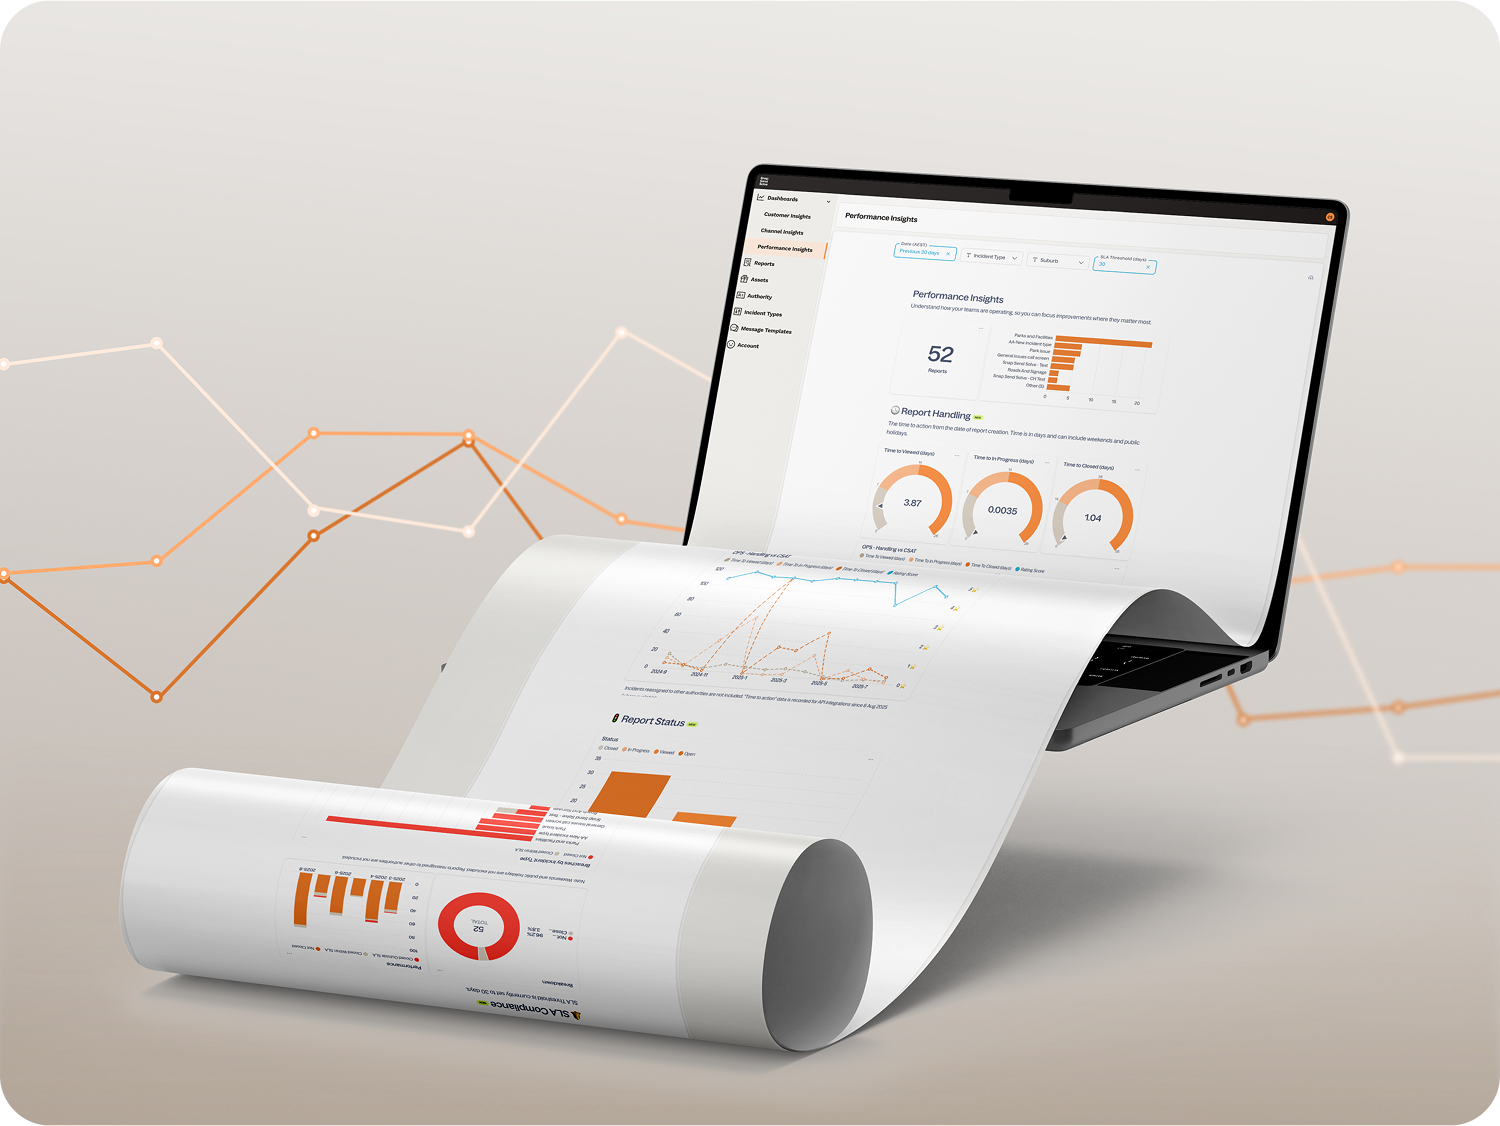
Track service performance with clarity
The Performance Insights Dashboard* gives CX managers and service leads a clear, real-time view of how service requests are being handled across their organisation.
With configurable SLA settings and filterable performance data, it’s never been easier to monitor team efficiency, demonstrate accountability, and plan service improvements with confidence.
*Solvers will have access to varying dashboards and filters depending on their subscription tier.
See report handling performance at a glance
Quickly access data on how reports are being managed, with filters for date, suburb, and incident type.
Whether you’re reviewing daily operations or long-term patterns, the dashboard makes it simple to understand how your organisation is performing.
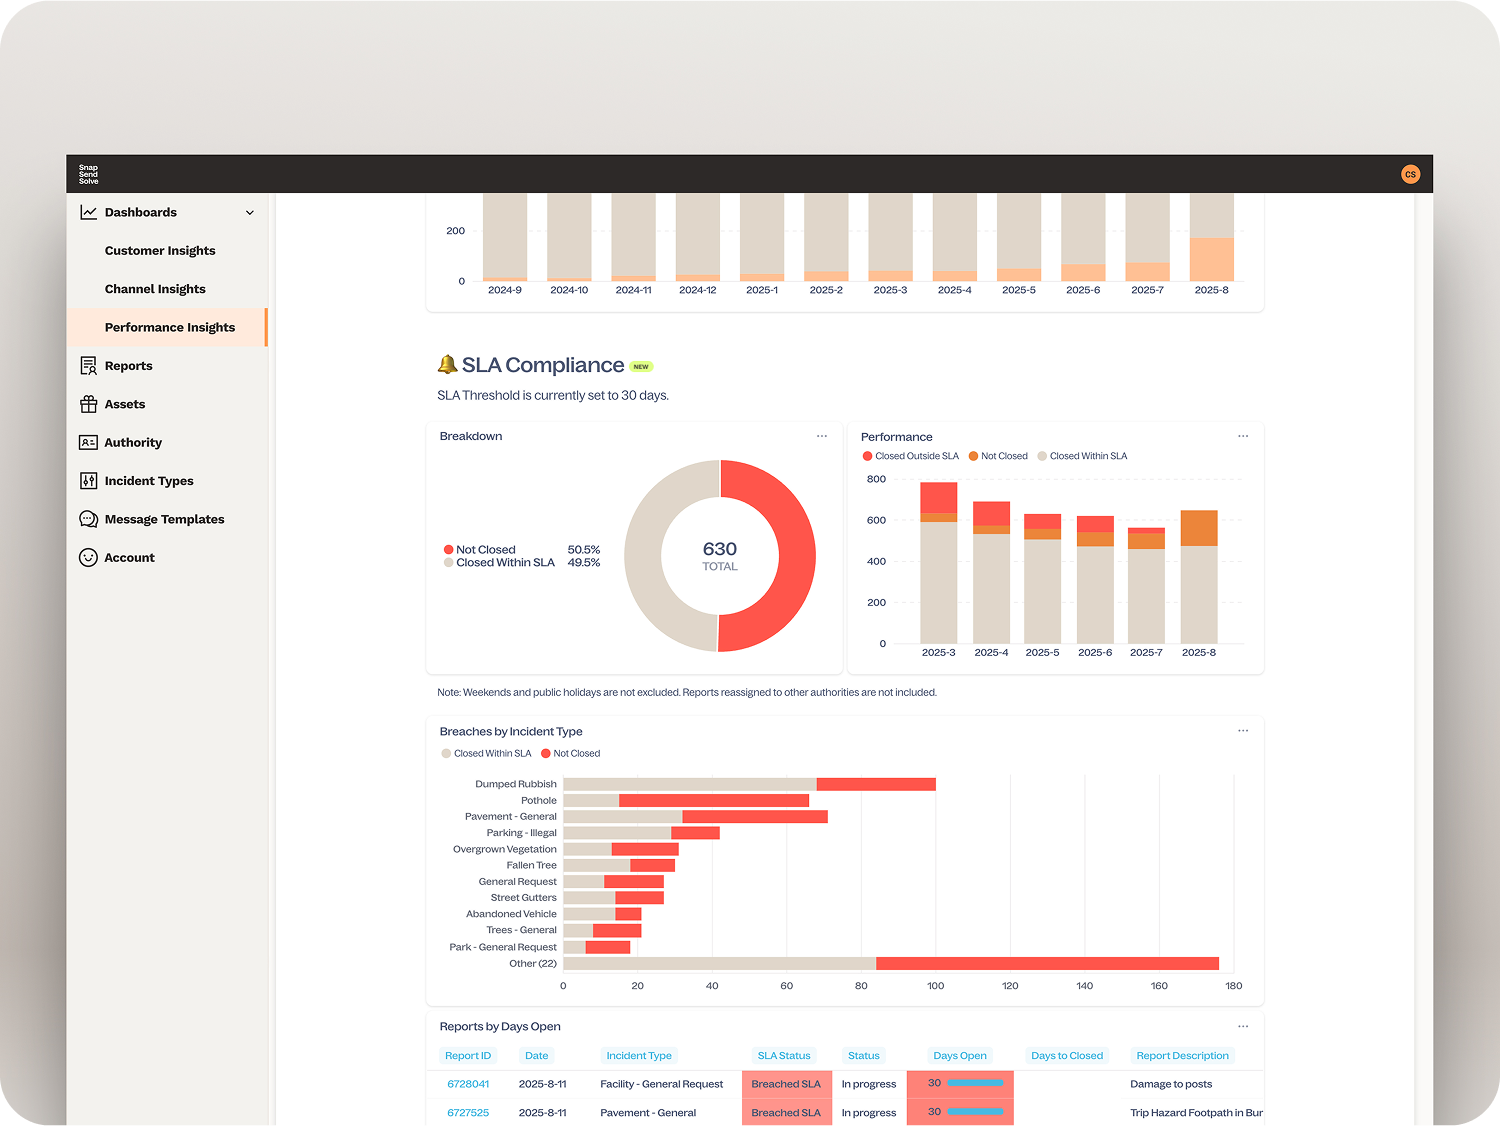
Demonstrate SLA performance with confidence
Track performance against service standards with clear, configurable SLA reporting.
By setting SLA thresholds by incident type, you’ll see exactly where targets are being met and where attention is needed. Making it simple to report on progress, show accountability, and support service planning.
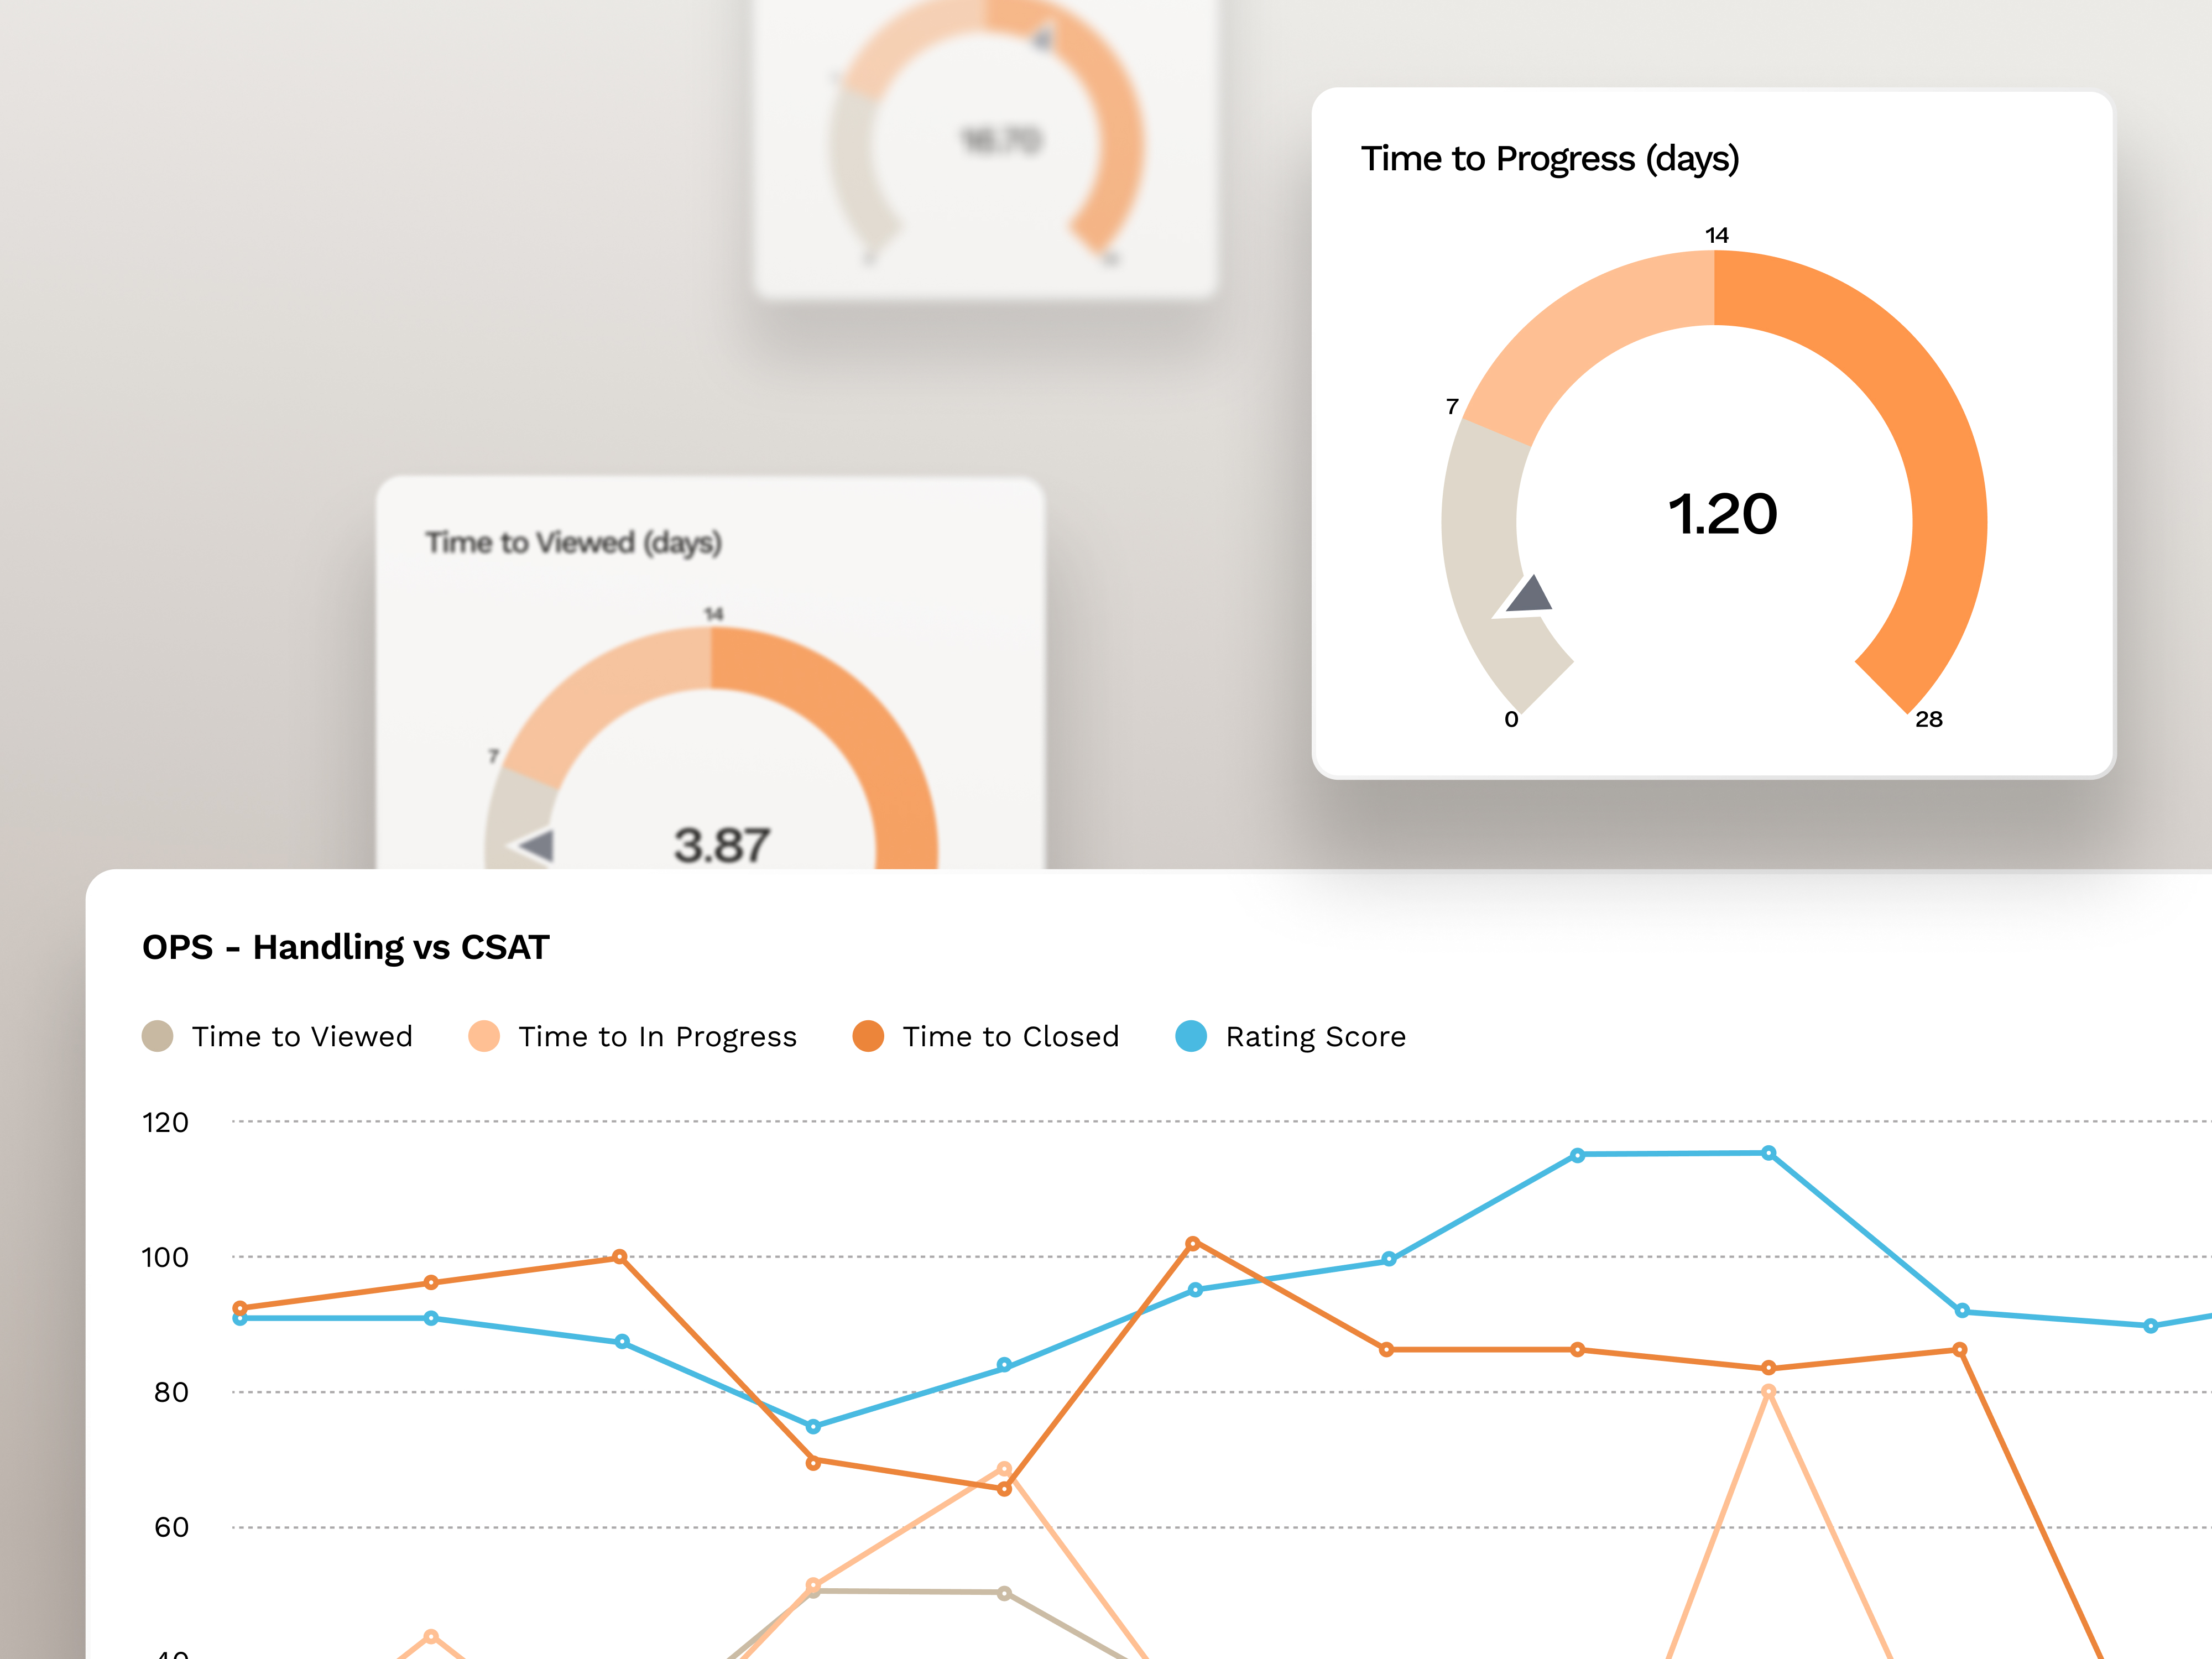
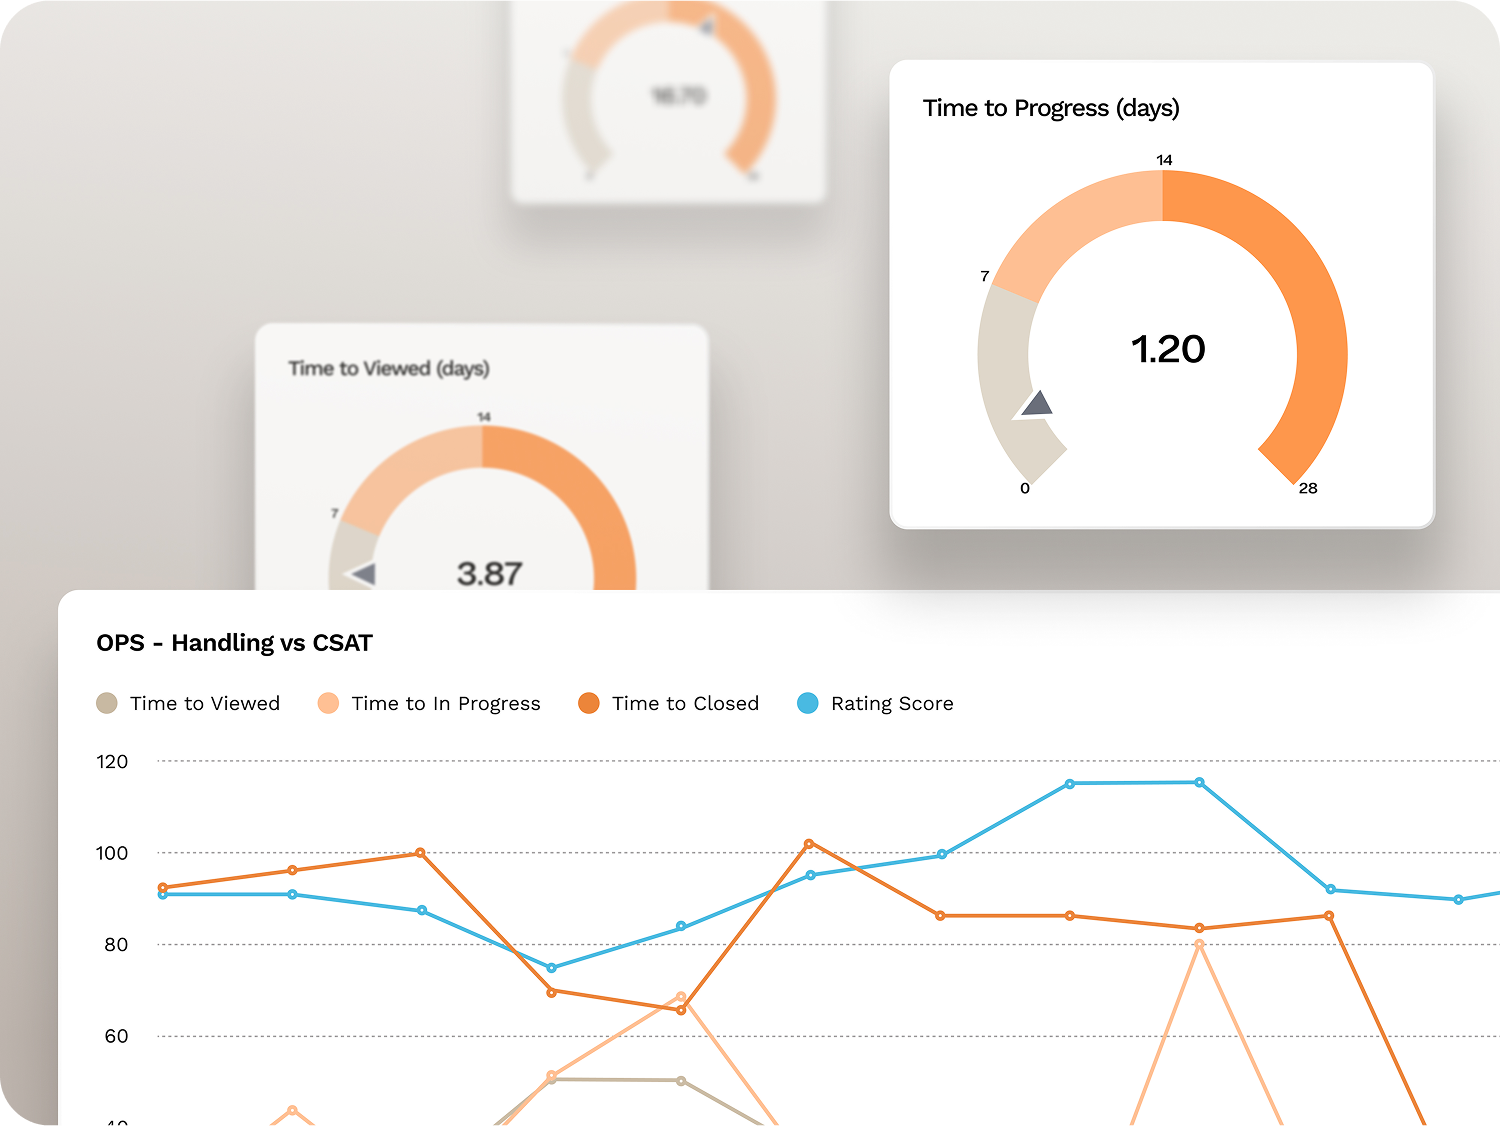
Visualise performance with ease
The Performance Insights Dashboard turns complex SLA data into simple, intuitive visuals.
Instead of sifting through spreadsheets, you can instantly see how your team is performing, compare results over time, and highlight areas that need attention, all in a format that’s easy to share with executives or across teams.


See the Performance Insights in action
Book a demo to explore how dashboards can give your team clearer insights, more accurate SLA tracking, and smarter reporting.