Map View

Keen to understand at a glance what issues are trending in your community and where attention is needed most?
Now, you can. The new map view in the Snap Send Solve Portal gives you a real-time view of Snapped issues, helping you allocate resources, schedule work, and spot trends faster.
Whether it’s potholes, overgrown vegetation, or storm-related damage, you can now spot patterns, track emerging trends, and take proactive action.
What’s new?
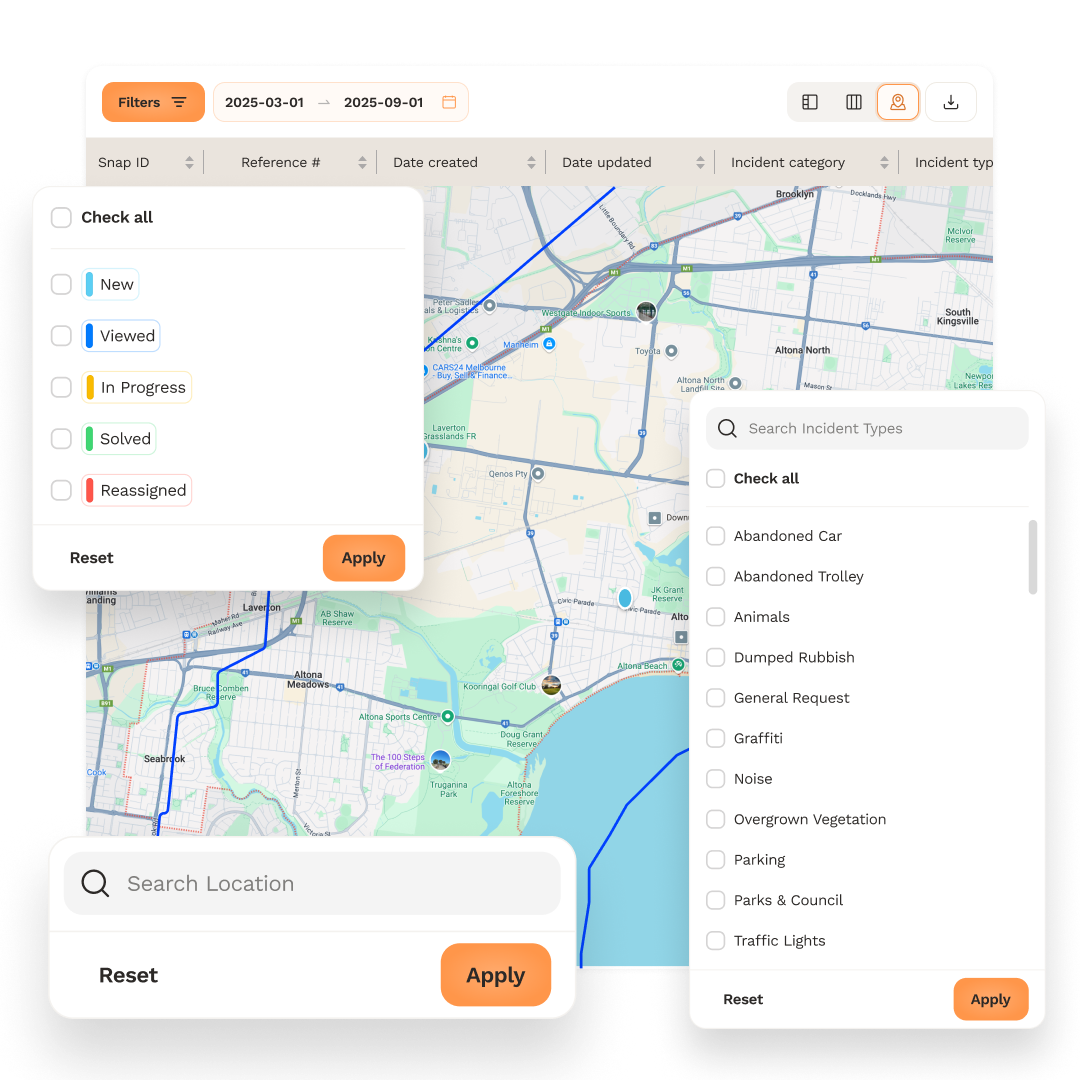
The map view
Toggle between list and map views to visualise Snaps at a glance.
The map view provides a holistic view of all requests in your service area, allowing you to zoom in on specific hotspots or click into Snap clusters for a closer look.
Teams will be able to identify areas where cross-departmental collaboration can be implemented, improving coordination and response efficiency across your organisation.

Filters for precision
Easily refine your view by filtering Snaps based on incident type, suburb, reference number etc.
Whether you're prioritising pothole repairs, scheduling vegetation management, or tracking specific service requests, these filters help you focus on what matters most and allocate resources efficiently.
Plus, filters apply seamlessly to both the map and list view, ensuring a consistent, streamlined experience.
Heat mapping
Quickly identify high-demand areas and recurring problem zones with real-time heat maps.
These visual insights dynamically update based on your filters, allowing you to refine by suburb or incident type to pinpoint trends and proactively mitigate issues in planning.
Heat mapping also highlights emerging issues, enabling your team to take a proactive approach by identifying and addressing potential problem areas before they become major concerns.
.png)
City of Perth: Turning map insights into action
City of Perth previously relied on ad hoc, manual Power BI reports to identify issue hotspots like graffiti, noise complaints or antisocial behaviour in public spaces when required. These reports were time-consuming to build and limited how quickly the city could coordinate targeted responses.
Now, with Snap Send Solve’s Map View, the team has instant access to live, location-based insights across 70+ incident types, no analysts, setup, or reporting tools required.
“We used to rely on Power BI to track hotspots, but Snap Send Solve’s heatmap means we don’t have to build anything, we can just see what’s happening and act. It’s one less thing for us to do, and a lot faster.” – Guy Macleod, Customer Experience Coordinator, City of Perth
Maps in the Snap Send Solve portal now inform weekly team reviews, quarterly executive reporting, and real-time coordination with both external stakeholders and internal operational teams.
“We review the map weekly and include insights in our executive reports. It helps us prepare for seasonal spikes like noise complaints from festivals. We can proactively manage expectations and deploy safety measures where they’re needed.” said Guy.
Snap Send Solve’s heatmap capability now complements the city’s 800+ CCTV assets, helping teams spot issues in parks and streets sooner. The result? Faster, better-targeted responses, whether that’s deploying rangers, coordinating with police, or planning communications for upcoming events.


Ready to see it in action and start using the map view today?
Enterprise Solvers will find the map view toggle on the right side just below the date range banner. Don't have access to the map view toggle? Get in touch with us for a demo.