Customer insights at your fingertips
The Customer Insights Dashboard* helps you stay connected to community sentiment with on-demand visibility of customer satisfaction scores, feedback, and performance benchmarks.
Built for CX managers and operational leaders, the dashboard gives you on-demand access to insights that help your team act quickly, report clearly, and improve satisfaction over time.
*Solvers will have access to varying dashboards and filters depending on their subscription tier.
Live, on-demand insights
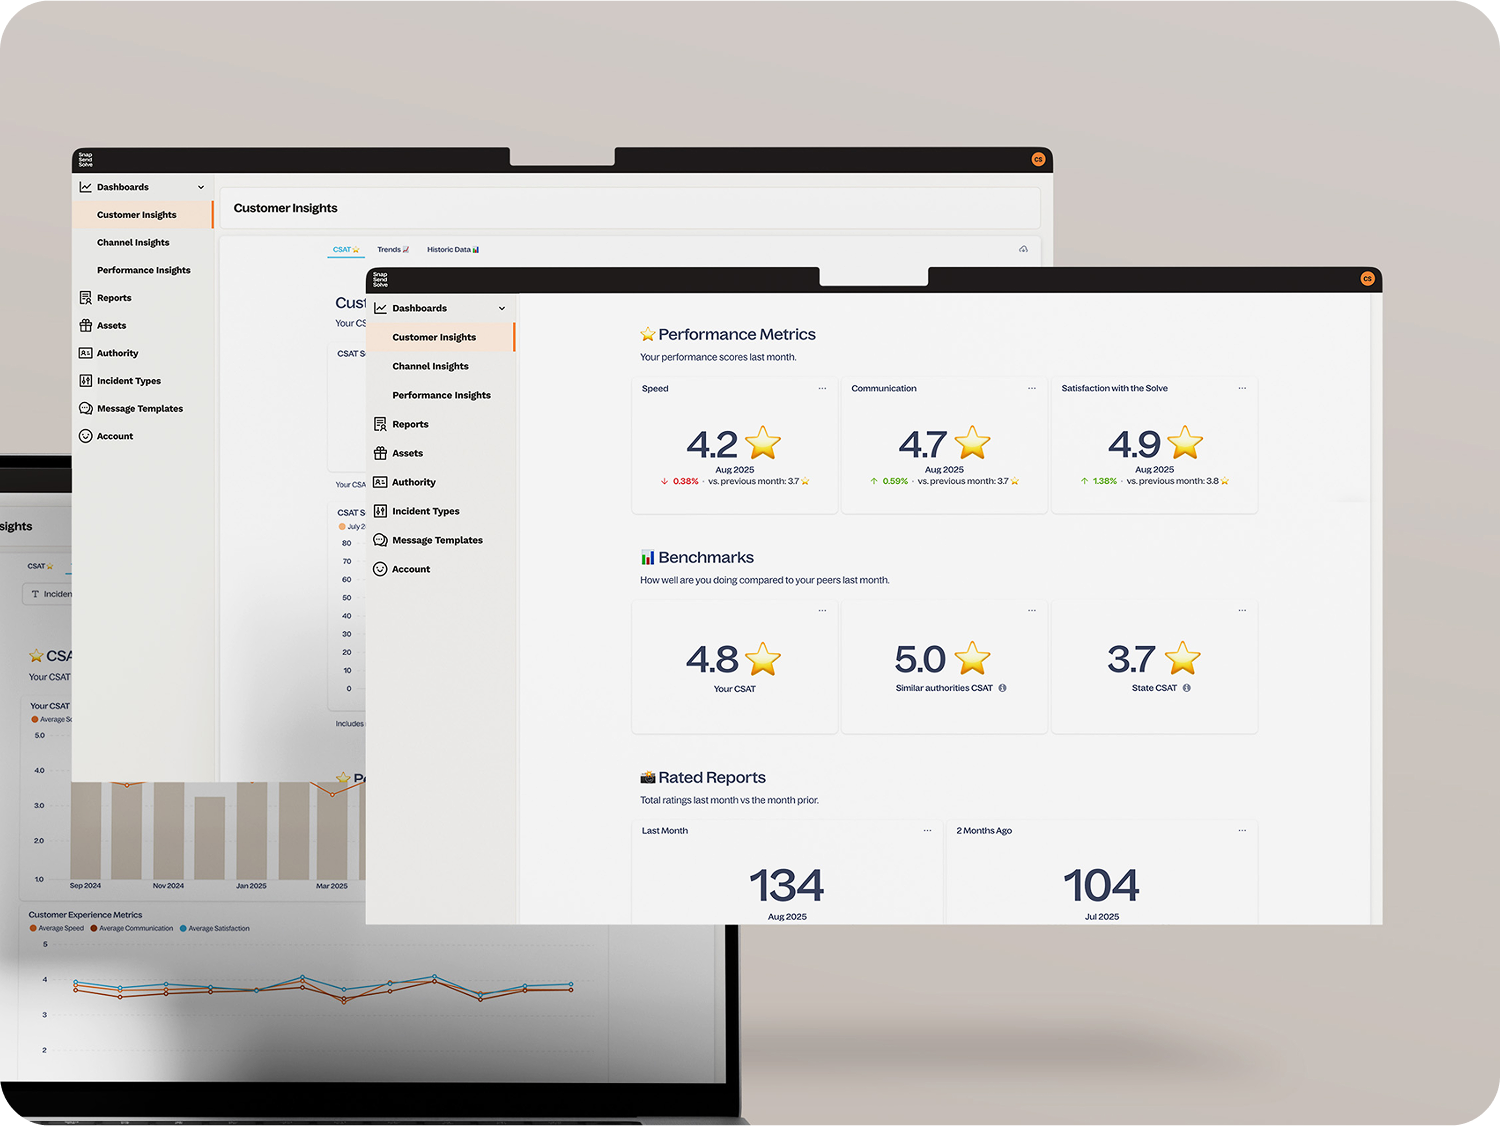
The Customer Insights Dashboard makes it easy to see exactly how your community feels, whenever you need it. Access current CSAT scores, recent feedback, and performance metrics in one place, perfect for quick updates, team reviews, or executive reporting. With everything ready to go, you can spend less time gathering data and more time improving outcomes.
Spot trends and understand what’s changing
We’re making it simple to see how satisfaction shifts over time.
Track CSAT scores, rating volumes, and performance across the past 12 months, with filters for suburb and incident type. With clear patterns at your fingertips, you can spot improvements, identify challenges early, and focus your team where it matters most.
Benchmark your performance
Benchmarking is built in, so there’s no need to run comparisons yourself.
Your CSAT score is automatically measured against both the state average and similar authorities*, giving you instant context to show where you’re excelling and where there’s room to grow.
*Solvers across the country that share your authority type.
What you’ll find in the Customer Insights dashboard
The Customer Insights Dashboard includes three tabs that surface the insights that matter most, from high-level trends to individual report feedback.
CSAT Tab
Get a clear, monthly view of satisfaction scores, performance metrics, benchmarks, and verbatim feedback from your community, all in one place.
Trends Tab
See how satisfaction shifts over time, with 12 months of data that can be filtered by suburb or incident type to highlight what’s improving and where challenges remain.
Historic Data Tab
Access your complete record of customer feedback and operational data, with month-by-month results and detailed ratings to support reporting and deeper analysis.


Discover what Solver dashboards can do for your team.
Book a demo and learn how to unlock better data, benchmarks, and community insights.